tata
Virtual internship with tata
Description
This is a virtual internship project provided by TATA. It was basically a visualization project, the questions asked were to be answered by visualization. The data was provided within the question .
question asked :
An online retail store has hired you as a consultant to review their data and provide insights that would be valuable to the CEO and CMO of the business. The business has been performing well and the management wants to analyse what the major contributing factors are to the revenue so they can strategically plan for next year.
Environments used
- Microsoft Excel
- Tableau
Project walk through
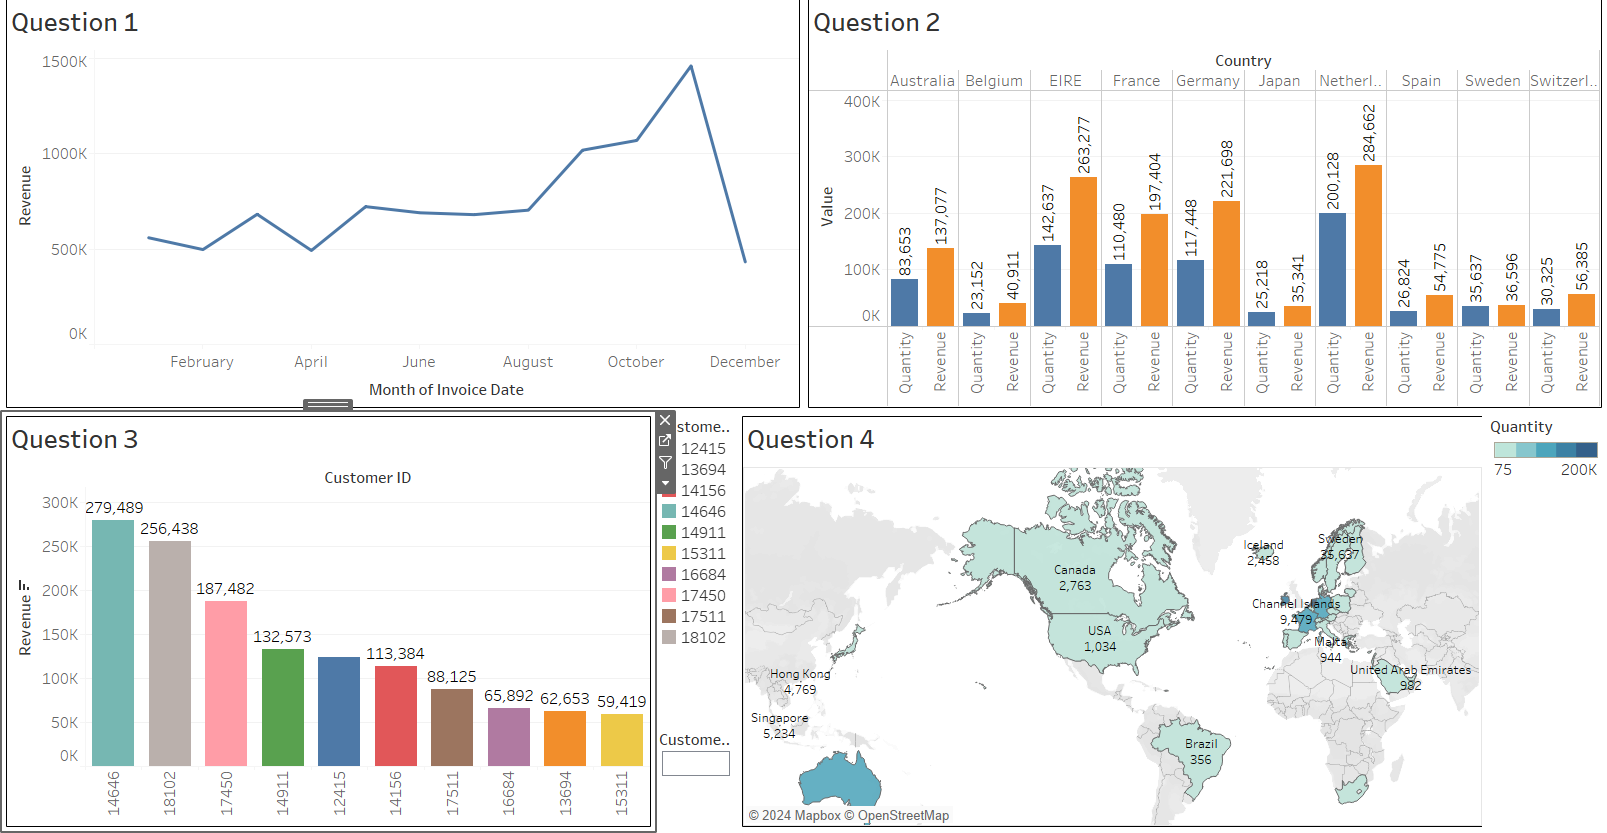
Question 1
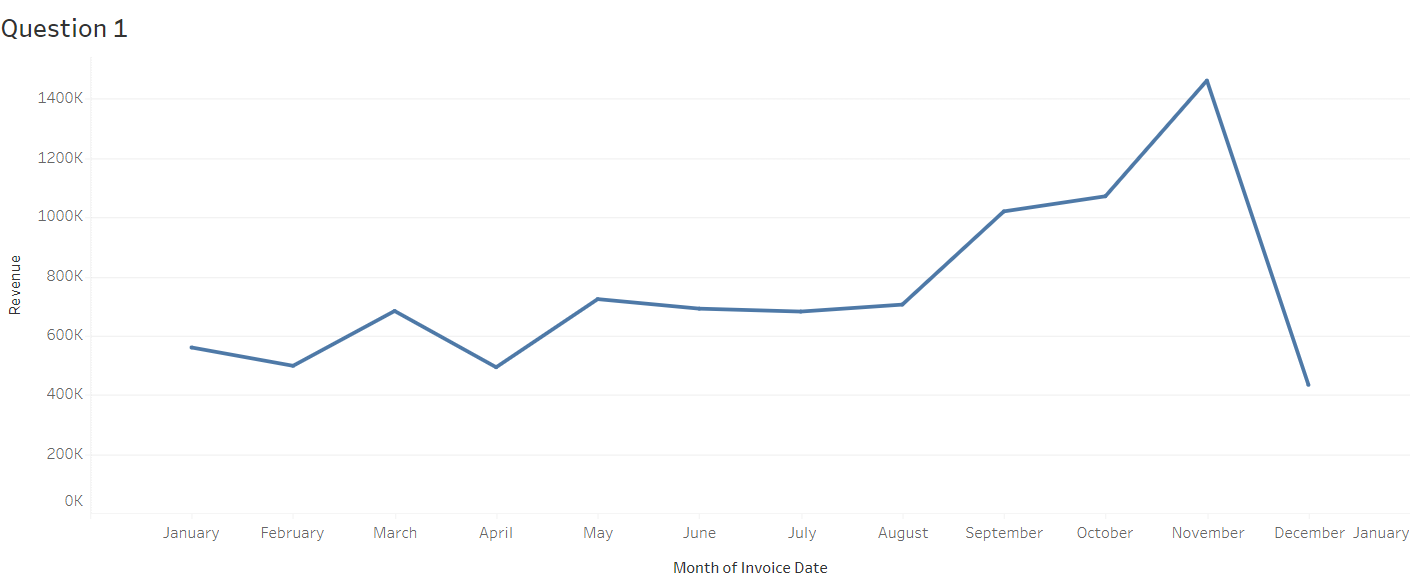
The CEO of the retail store is interested to view the time series of the revenue data for the year 2011 only. He would like to view granular data by looking into revenue for each month. The CEO is interested in viewing the seasonal trends and wants to dig deeper into why these trends occur. This analysis will be helpful for the CEO to forecast for the next year.
Quesion 2
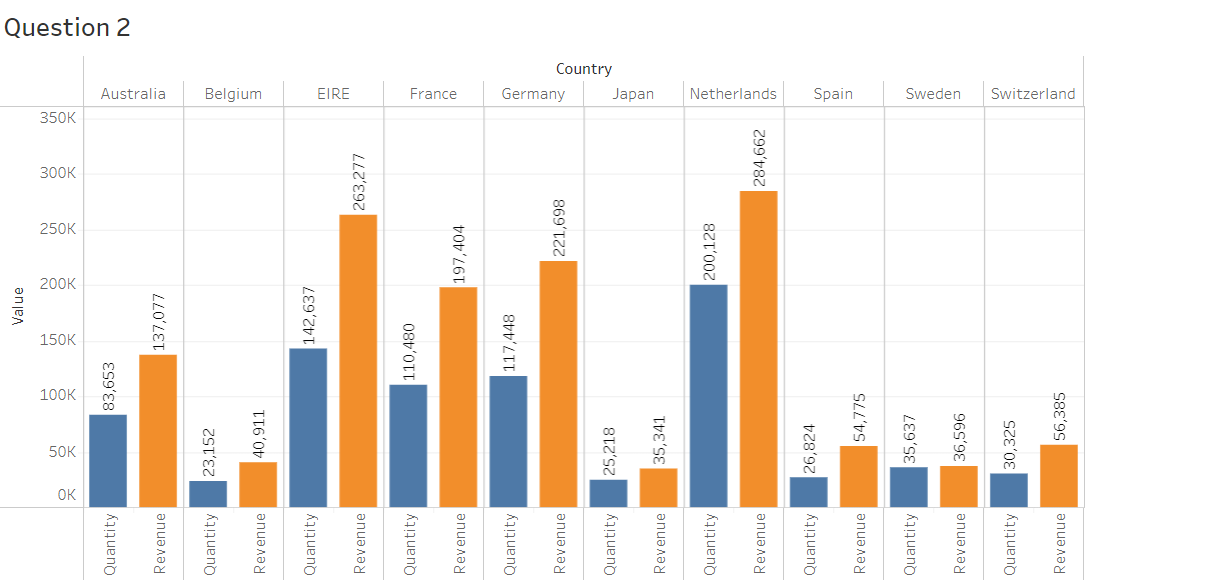
The CMO is interested in viewing the top 10 countries which are generating the highest revenue. Additionally, the CMO is also interested in viewing the quantity sold along with the revenue generated. The CMO does not want to have the United Kingdom in this visual.
Question 3
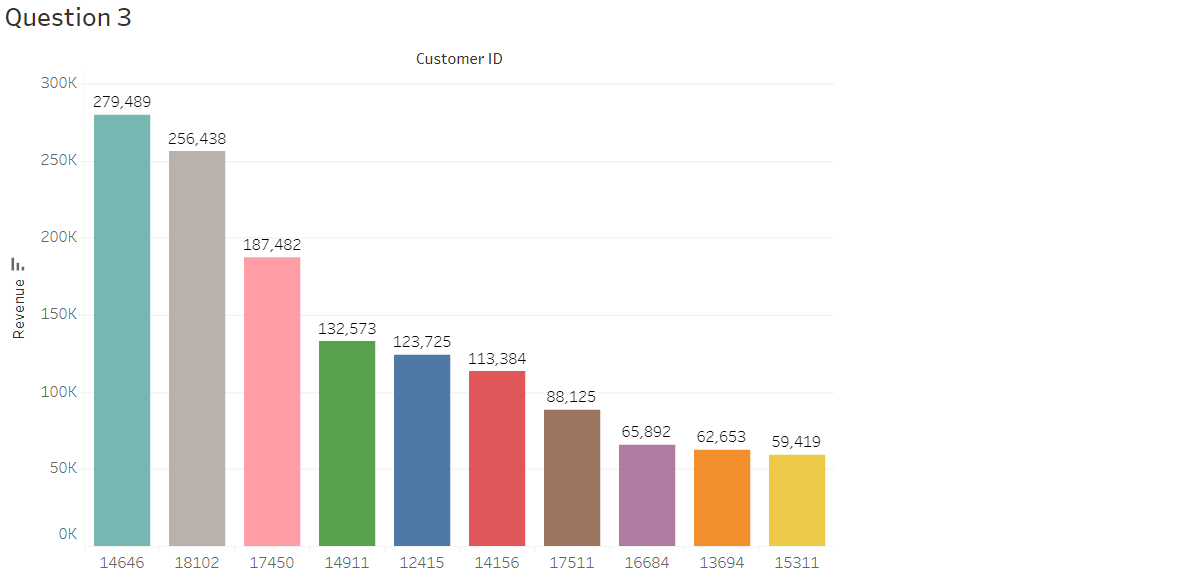
The CMO of the online retail store wants to view the information on the top 10 customers by revenue. He is interested in a visual that shows the greatest revenue generating customer at the start and gradually declines to the lower revenue generating customers. The CMO wants to target the higher revenue generating customers and ensure that they remain satisfied with their products.
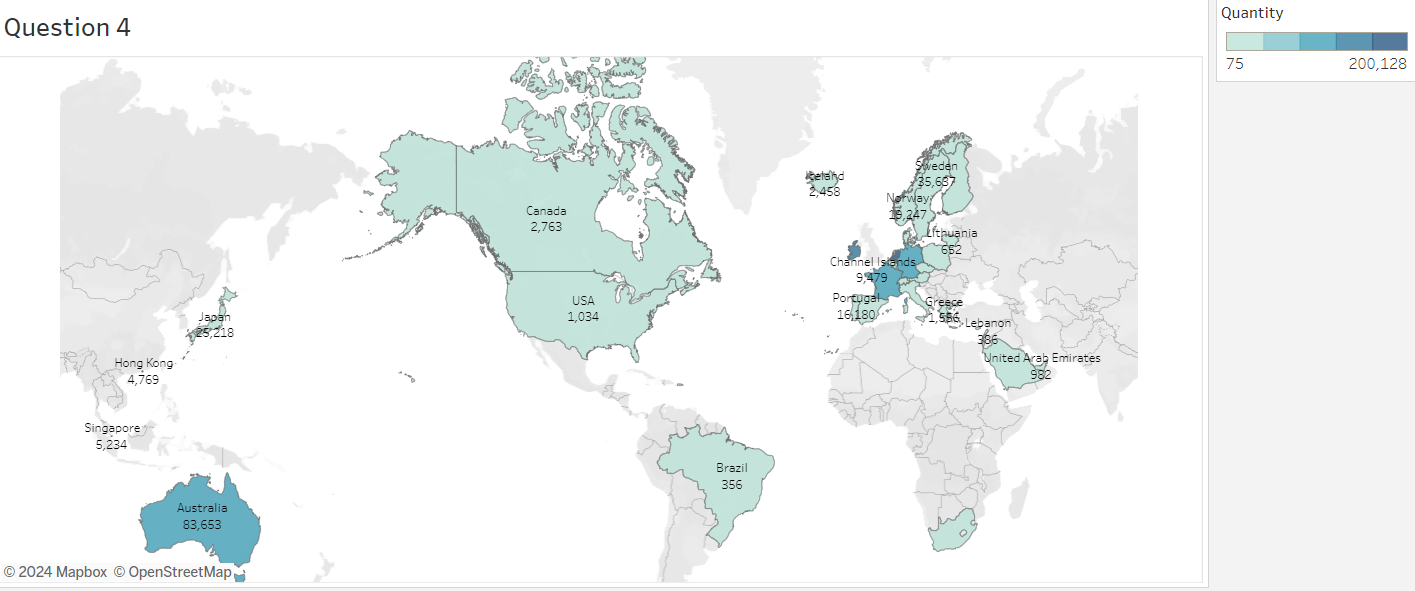
Question 4
The CEO is looking to gain insights on the demand for their products. He wants to look at all countries and see which regions have the greatest demand for their products. Once the CEO gets an idea of the regions that have high demand, he will initiate an expansion strategy which will allow the company to target these areas and generate more business from these regions. He wants to view the entire data on a single view without the need to scroll or hover over the data points to identify the demand. There is no need to show data for the United Kingdom as the CEO is more interested in viewing the countries that have expansion opportunities.
Final Dashboard
Project Certificate